SREcon EMEA 2019 - Day 2
Here's a summary of the attended talks:
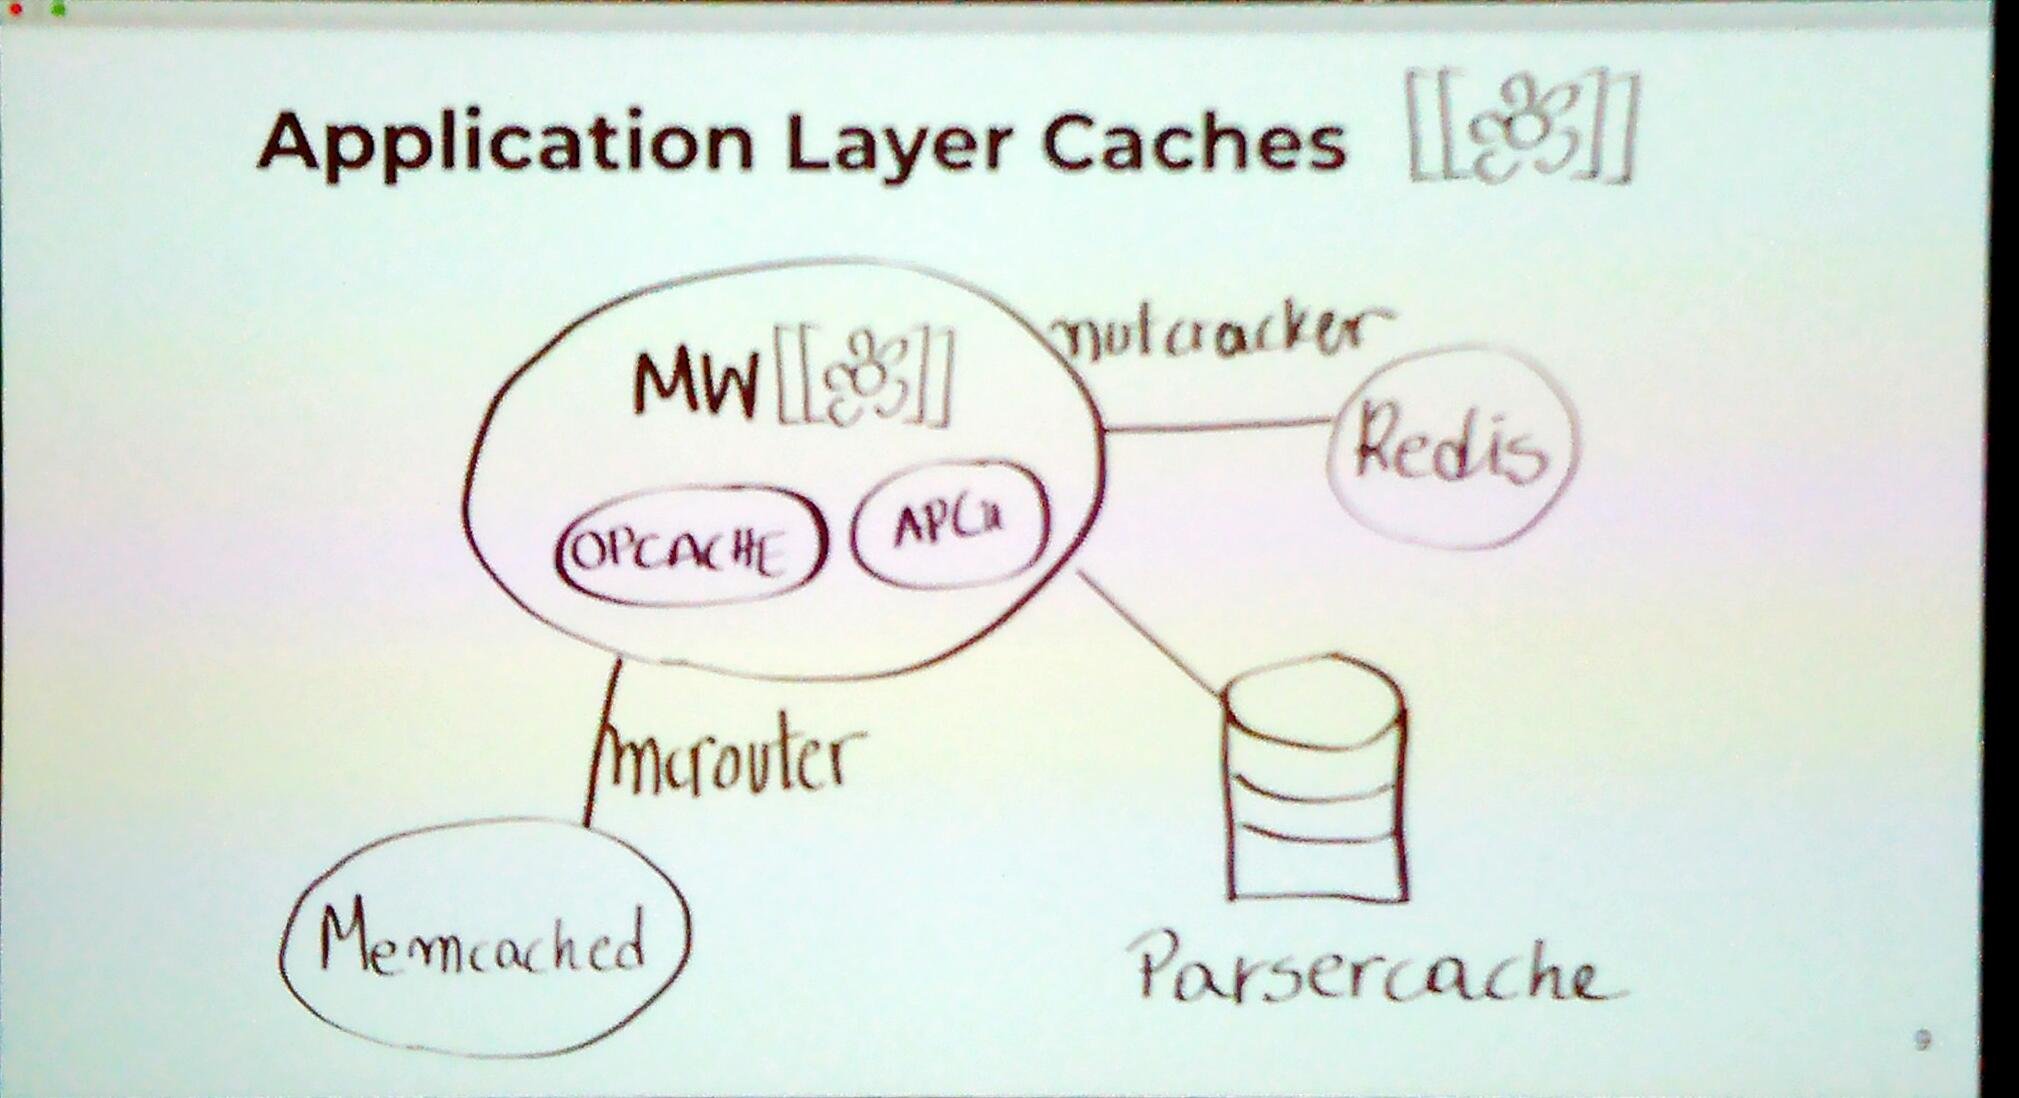
Advanced Napkin Math: Estimating System Performance from First Principles
Advanced Napkin Math: Estimating System Performance from First Principles
How fast should a system be for certain actions?
Example: 8 bit GET query to a local Redis: 10 µs
Base rates: Cost (loosly based on Google Cloud Calculator
- CPU: $10/core/month
- Memory: $1/GB/month
- SSD: $0.1/GB/month
- Disk: $0.01/GB/month
- Cloud-storage (S3): $0.01/GB/month
- Network: $0.01/GB/month (between zones, ingress, between regions)
- Reading 1 GiB of sequential memory takes: ~100ms
- Reading 1 GiB from SSD takes: ~250ms
- Writing 1 GiB to SSD takes: ~500ms
- Writing 1 GiB of random memory in 64-bit increments takes: 1.5 seconds
- Transfering 1 GiB from one Cloud Region (not zone) to another takes: ~1 minute (150 Mbit/s)
See also: https://github.com/sirupsen/base-rates
You need less precision than you think: Provide quick approximation within an order of magnitude of the real answer.
Example: Why did it once take 2-3 seconds to serve a response for some website from D.C. to Australia.
- Render time: ~100ms
- Round-trip time between DC and Australia: ~250ms
- Request cycle round-trips: ~4.5 from DNS(1), TCP(1), SSL(2), HTTP(1)
- Expected response time: 4* 250ms + 100ms = 1.1 seconds May take a lot more than 1.1 seconds, because of TCP slow start. The mental model is wrong.
https://wondernetwork.com/pings
Example: Shop with 2^21 products and apply <= 64 filters. How long will it take to get a result?
First principle thinking is required to break out of habbits. And allow improvments in an order of magnitude.
Practice:
- communis.io (Anki, Messenger Bot)
- Apply them to your own problems
SRE by Influence, Not Authority: How the New York Times Prepares for Large Scale Events
SRE by Influence, Not Authority: How the New York Times Prepares for Large Scale Events
How to drive change if teams are not required to work with you.
Delivery Engineering:
- Teams as customers
- incentivize vs. standardize our tooling and processes
- Feedback to drive decisions
Architecture Review Template
Application Overview Diagram Repositories Documents & Resources
- RFCs
- Documentation
- SLOs (if they exist)
- Monitoring
- Logging
- Projects & Accounts
- Load
- Load Test results
- Normal traffic graphs Questions:
- What part of the application is most likely to fail?
- How do you determine if the application is healthy?
- Are those health checks automated? Could you provide an endpoint for us to scrape
- What systems does your application rely on?
- Can your application survive if a dependent system fails? If so how long?
prepare for extrem conditions Rice and prioritze finding
- Crate a ticket for reliability issues
- scrum of scrum: talkthrough blockers Plan degradation strategy Incidents:
- Understand Role: Incident Commander
- Incident Lifecylce
Load Balancing Building Blocks
Load Balancing Building Blocks
Every Request to Facebook goes at least through 7 loadbalancers.
Loadbalance because:
- too many requests
- defending against failure
- grace fully add capacity
Prox L4/L7 Loadbalancer:
- SPOF
- Active/Passive
- Health Checking Backends
- Backend Failure: TCP reset
-
History:
- L4 because CPU was the bottleneck before the network became a bottleneck
- Increased CPU allows L7 features Prefare L7 over L4 these days
DNS Loadbalancing flavours:
- RR DNS
- Anycast DNS
- Geoaware DNS
- Network aware NDS
- Latency aware DNS Problems:
- caching (short TTL doesn't fix anything)
- Anycast routing not always optimal
- Limited information - resolver doesn't pass information on
Latency measurement:
- combine DNS resolver (specific url, e.g.: uuid.zone.facebook.com) logs with webserver logs (host: uuid.zone.facebook.com)
Why POPs:
- less complex than an entire new region, because it only serves web traffic
- RTT to POP is significant lower
- POP to DC has an already active connection
You need a global LB if the requests exceed the POP capacity. Facebooks solution is cartographer: Direct traffic to POP/DC as much as it can handle. cartographer uses DNS LB. It asnychronously builds a map for traffic distribution.
MagLev LB:
- Equal Cost Multi Path (ECMP)
- TCP is statefull: need to end up at the same server
- needs invasive changes to the network
- Invented by Google:
What Happens When You Type en.wikipedia.org?
What Happens When You Type en.wikipedia.org?
Wikipedia runs on ~1300 Bare Metal Servers in 3 main Data Centers. Their main application is Mediawiki, a LAMP Stack application.
Wikimedia is moving from Mediawiki and Parsoid to a micro service appliation.
Kubernets:
- Bare Metal + Puppet
- Calico as CNI
- Helm Deployments
- Docker as CRE Message Queuing:
- Apache Kafka MariaDB:
- Divided into sections (shareds)
- Cross DC replication
- TLS accross all DBs
- Snapshot and local dumps for DR Storage:
- Swift
- HTTP
- easly scalable
- 390 TB of Data Network:
- Ping: offloading servers (everybody pings wikipedia.com to check if the network is ok) CDN:
- TLS: Nginx
- Varnish: FE (in memory)
- Varnish: BE (local storage)
- ??
- Migration to Apache ATS (needed features are only available in nginx+ and varnish+)
Workshop: Statistics for Engineers
Git Repo: Statistics for Engineers
Per default the script in the Repo expects a .circonusrc.json. If you're not a circonus customer, you have to adjust the prelude.py script. Open 2019-10-02-SRECon-Dublin/prelude.py and remove all lines after and including with open(os.path.expanduser("~/work/.circonusrc.json"),"r") as fh:. Thats it.
This is a challenging workshop. Heinrich shows a lot of code and diagram samples and explains a lot. But it is quite hard to follow. In this Git repo is a Dockerfile which creates a jupyter notebook environment where you can test all his examples.
Everyone who is interested in metrics and monitoring should take a look at his Git repo.